IQ scale or graph
IQ tests are standardized after they have been taken by many thousands of people (5,000 - 20,000). After that, the average IQ level is set to 100 points. An IQ score above or below this norm is used to establish a person's actual IQ level, according to the bell curve.
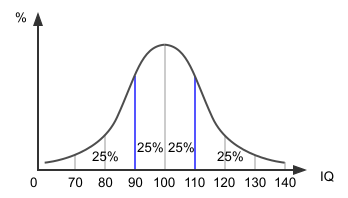
For most people, intelligence test scores fall in the middle of the IQ scale (or IQ graph). This means that the average IQ level is found in about 50% of the population and fluctuates between 90 and 110 points. At the same time, an IQ indicator of 100 points is the “magic” number of the average IQ. Below is a standard IQ scale with an average IQ of 100.
IQ scale
On our site you can see the IQ rating of the countries of the world by average level. You can also take one of our IQ tests to find out your IQ level.
Our site collects statistics on IQ test results for 201 countries of the world. In each country, the average IQ level may differ from the standard level of 100 points. Therefore, when summing up the results of all countries, the overall IQ scale (or IQ chart) is distorted from a normal distribution - the «bell» curve. For the same reason, the average IQ level of all countries of the world together differs from 100 points.
If you make an intelligence test targeting users from high IQ countries (according to the exact bell curve), then users from low IQ countries will find it very difficult to pass such a test. Therefore, the international test needs to be “smoothed” a little.
In general, if an intelligence test is designed for international use, then it will not be possible to accurately form the “bell” curve, since the shares of users from different countries are not stable. But if you look at the IQ scale of one country with a high IQ and a lot of test scores, you will see that the bell curve is close to normal. Although its peak may not be at the level of 100 points, because the average intelligence in this country is above 100 points. But the shape of the diagram resembles the shape of a bell, although the size of the columns of the diagram may slightly differ from the standard sizes.
IQ scale (chart)
To see the IQ scale for a particular test in any country, you can select the test number below and click on the button.
IQ statistics
|
Test number
|
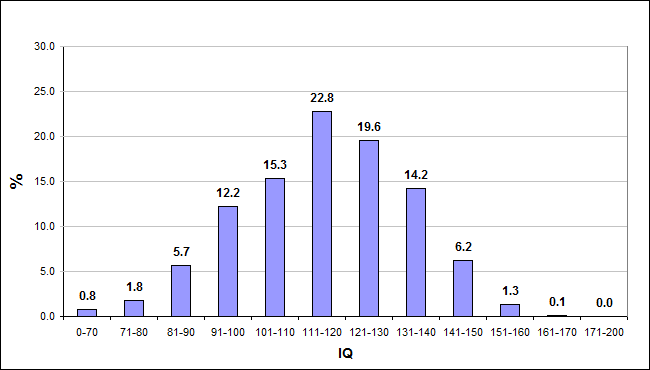
Some users perform an IQ test not to the full extent of their capabilities. Some users perform the test with preliminary preparation for testing. That is, they have already passed intelligence tests before. As a result, our site's statistical chart deviates slightly from the bell curve. It is necessary to take this into account when analyzing the statistics of our site in depth.
It is not uncommon for users to complete the test more than once, which distorts the statistics. We try to remove such duplicate results from the statistics, which improves their accuracy.
After an IQ test, you can see how well you did on the test by referring to the IQ scale (IQ chart). Our IQ scale shows how intelligence is distributed among the general population. It shows the results of intelligence tests, divided into groups of 10 points.
-----------------------------------------------------------------------------------------------------------------------------
